Ontario's LT2 Window 1
What the Results Signal for Ontario's Energy Future
April 28, 2026
The IESO released results for the first window of the Long-Term 2 (LT2) Energy procurement in early April 2026, awarding 20-year contracts to 14 projects totalling 1,315 MW of capacity and 3.02 TWh of annual energy. This was the first competitive renewable energy procurement in Ontario in over a decade. The last was the Large Renewable Procurement Phase I (LRP I) in 2016, under which the IESO contracted 439 MW of wind and solar capacity across 16 projects.
Beyond the headline numbers, the results carry three implications worth unpacking for developers, investors, and utilities active in the Ontario market:
- Solar is now directly competitive with wind in Ontario. Solar projects took 58% of contracted energy despite wind’s historically stronger resource in the province, reflecting a decade of falling solar costs, a trend playing out across comparable markets globally.
- Local opposition has effectively closed Ontario’s best wind region, with lasting consequences. The southwest, which holds the province’s strongest wind resource, received no municipal support. Future wind development will be concentrated in the North, where capacity factors are lower and significant transmission investment is required before the region’s full resource potential can be unlocked.
- Ontario’s contract structure created an embedded option that some developers appear to have exercised. The ability to specify contracted volume independently of expected generation gave proponents a lever to enhance bid competitiveness by taking on a modest merchant position, one that solar developers, with their more stable and forecastable output, were better placed to use than wind.
Foundation Economics has supported clients with bid strategy, competitive analysis, and pricing support in both the LT2 energy and capacity streams, as well as procurements across North America. This post draws on our market knowledge and publicly available results to offer perspective on what this procurement reveals and where the Ontario market goes from here.
Results at a Glance
LT2 Window 1 — Results at a Glance
The 14 winning contracts span 12 solar and 2 wind projects, representing 1,315 MW of capacity and 3.02 TWh of annual expected energy over 20-year terms, with projects expected online by May 2030.
One of the more telling aspects of the results is how uniformly projects performed on the rated evaluation criteria. Every winning project earned nearly all available rated criteria points: all 14 have Indigenous equity participation at or near 50% ownership; all are outside prime agricultural areas; 13 of 14 self-identified as Canadian Status Proponents; and almost all are sited within Ontario's defined transmission zones. With winning projects so closely matched on rated criteria, the competition came down to price.
The weighted average fixed price of $87.80/MWh sits comfortably within the range of comparable recent procurements across North America and is 21% below the 2016 LRP in nominal terms. When accounting for the federal 30% Investment Tax Credit that today's projects benefit from, the real cost of new renewable energy in Ontario has been broadly flat over a decade.
This is worth reflecting on. Turbine and panel cost reductions and performance improvements have offset inflation that has been sharp across almost every other major infrastructure category over the same period. This is particularly true for solar, which priced below wind in this RFP — a result that is not an anomaly, as explained in the next section.
LT2 Pricing vs. Comparable Procurements
Weighted Average Energy Costs in C$/MWh , Nominal

Community Opposition Closed the Southwest to Wind
Wind development in Ontario has historically been concentrated in the Southwest, where flat terrain, strong wind resource, and established infrastructure supported the province’s most attractive projects. None of the ~1GW of wind projects Foundation tracked in this region received municipal support. This is consistent with a trend seen in other markets, local opposition and competition for land use is usually a constraint to the most economic wind region.
The two winning wind projects, Gichigami Wind and Northern Breeze, are both located in Northern Ontario, reflecting a broader shift in development away from the South. With southern projects constrained, new wind development is moving north despite higher costs, more limited infrastructure, and more complex transmission requirements. This comes with a tradeoff: estimated capacity factors in the South typically range between 38% and 40%, compared to most identified projects in the North, which fall below 35%. Notably, the two winning projects rank among the highest capacity factors observed within the Northern development pipeline. As a result, future wind development in Ontario is likely to remain concentrated in the North, with transmission availability as the primary constraint on buildout.
Wind Capacity Factor Estimates by Region
Foundation Estimates for Identified Projects

Development Timeline: Solar's Shorter Path to a Biddable Project
The window between the LT2 announcement and bid submission left limited time for developers to advance projects to a bid-ready state, disproportionately impacting wind relative to solar. Wind development in Ontario had been largely dormant for over a decade, leaving few projects with the multi-year on-site meteorological data typically required to underpin a credible bid. Without that data, capital cost estimates, equipment sizing, and interconnection assessments carry materially higher uncertainty. With significant bid security requirements, developers faced real financial exposure if assumptions proved incorrect, leading many to either incorporate a risk premium or defer participation altogether.
Community opposition compounded this further by effectively closing Ontario's southwestern wind region, limiting active development to less mature northern regions where projects are earlier stage and data gaps wider.
Solar faces few of these constraints. Resource assessment is largely supported by satellite data, the path from site identification to bid readiness is significantly shorter, and lower bid security requirements reduce financial exposure. Several winning solar projects were developed by smaller or newer entrants, reflecting how accessible the process was relative to wind. Developers that initiated met tower campaigns following the LT2 announcement will be better positioned for future windows, which suggests the technology mix in Window 1 is more likely a function of timing than a structural feature of Ontario procurement.
Solar Cost Trajectory and Lower Development Barriers
Wind Turbine and Solar Panel Cost
US$/kW, Nominal

Solar projects took 12 of 14 contracts, representing 70% of awarded capacity (915 MW) and 58% of expected annual energy (1.76 TWh). This is new for Ontario, where wind has historically been more competitive in large-scale renewable procurement, driven by the province's strong wind resource. It is, however, consistent with a broader shift seen across markets globally. New York, a market similar to Ontario, is a useful point of comparison: the last two NYSERDA renewable energy procurements were similarly solar-led, reflecting the same convergence of factors that shaped the LT2 results.
Rapid deployment has driven solar panel and inverter costs down approximately 75% over the past decade, compared with a 13% increase for wind turbines over the same period. The gap reflects both a steeper technology learning curve for solar and the degree to which solar equipment has become a global commodity. Unlike wind turbines, which are engineered-to-order capital goods sold by a handful of manufacturers with meaningful pricing power, solar panels trade on global spot markets with hundreds of competing suppliers. The practical consequence was visible in 2025, when a surge in Chinese manufacturing capacity drove panel prices to historic lows. Prices have since begun to recover, but the structural cost advantage solar holds over wind equipment remains intact.
Development of solar also carries lower barriers to entry. Site selection is more flexible, environmental assessment processes are generally shorter, and the capital required to advance a project to a biddable state is lower. The winning project list reflects this: several solar winners are under 50 MW, developed by smaller or newer entrants not typically competitive in a wind procurement. Traditional large-scale IPPs are less prominent among the solar winners. Lower barriers and lower perceived risk support lower required equity returns for solar relative to wind, a spread we estimate at up to 200 basis points.
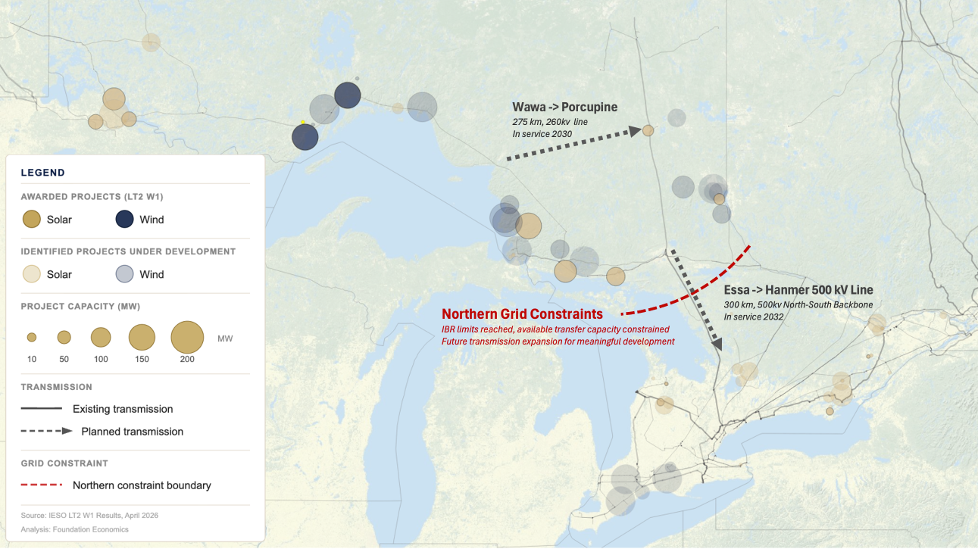
Northern Ontario: Awards Approach Grid Limits
Ten of 14 winning projects are in Northern Ontario, representing approximately 1,250 MW or 95% of awarded capacity. This was broadly expected: the evaluation methodology credited Northern projects with a 5% price adjustment, expected to more than compensating for higher development costs. This was only true because the high-capacity-factor Southwest wind region was absent from competition due to community opposition.
Awarded capacity closely approaches, and may exceed, the limits established in the IESO’s Deliverability Test Methodology communicated during the LT2 process. The methodology sets an aggregate inverter-based resource (IBR) limit of 1,000 MW across Northern Ontario, a threshold also referenced in the concurrent LT2 Capacity Stream RFP. In addition, more granular thermal limits, which vary by technology and region, are as low as 600 MW for wind in the Northwest and 1,200 MW for solar. Taken together, these constraints indicate that Northern Ontario is at or near capacity for new generation until additional transmission infrastructure is developed.
The Deliverability Test Methodology assumes completion of certain ongoing transmission upgrades. However, additional transmission development is likely still required to fully unlock resource potential in the region, particularly to support further wind buildout. As a result, the area is expected to remain constrained in the next LT2 energy window.
Wind and Solar Projects in Development Across Ontario
Identified projects based on Foundation Economics’ proprietary database
The Constraints Spill into the Capacity Stream
The same IBR limits that shaped the energy stream results will apply when the IESO evaluates the LT2 Capacity Stream, with results expected in summer 2026. Storage is widely expected to be far more price-competitive than gas under the capacity RFP structure, but Northern Ontario’s transmission constraints do not distinguish between technology types. If the IBR ceiling binds in the capacity stream as it did here, storage projects in the North may face the same deliverability barrier that wind and solar projects did, regardless of their economics.
The practical consequence is that the North could end up procuring little or no new capacity through the LT2 process, despite the region’s clear need. Gas is not subject to IBR limits and would not face the same deliverability barrier, but at current cost levels it is unlikely to clear a competitive auction against storage in the south. That creates a gap: a region that needs capacity, a technology that could serve it, and a procurement structure that may not bring the two together.
This points toward something the IESO will likely need to address directly. The case for a northern-specific or technology-specific capacity procurement, one that explicitly values dispatchability and the grid stability benefits that gas can provide, becomes stronger the more the general capacity stream concentrates awards in the south. Developers with gas assets or development rights in Northern Ontario may find that the next interesting opportunity comes not from the LT2 process but from whatever the IESO designs to fill the gap it leaves behind.
Contract Structure Encouraged Additional Merchant Risk
Implied capacity factors based on reported contracted volumes for some winning solar projects materially exceed Foundation’s internal estimates, in some cases by more than 15%. This suggests some proponents opted to optimize the structure of their contract volume, taking on a modest merchant position to enhance bid competitiveness. Implied capacity factors for winning wind projects do not show a similar pattern, indicating this was a lever available primarily to solar.
The LT2 RFP allowed proponents to specify both total contracted energy volume and the monthly delivery profile, without an explicit link to expected generation. Delivery performance is instead managed through downside thresholds tied to realized output: liquidated damages apply if a project’s three year rolling average generation falls below 80% of contracted volume, with contract default triggered below 65%. This structure gives proponents flexibility to size contracts above expected generation, which is equivalent to taking a short position at the fixed contract price. The project earns incremental revenue when the contract price exceeds market prices, but if market prices rise above the contract price, it must buy back the shortfall at higher market prices.
Solar’s more stable and forecastable generation profile gives developers greater confidence in taking on this risk. Wind’s more variable output introduces higher uncertainty around both monthly shape and total annual volume, increasing inherent merchant exposure even before any additional contract shaping. For solar developers comfortable with that tradeoff, contracting above expected generation may have been the margin that determined some winning bids.
Implied Solar Capacity Factors vs Foundation Estimates
Capacity factors implied by reported contract awards vs. proprietary FE estimates

Ontario’s electricity market is in transition on several dimensions simultaneously. Load is growing, driven in part by large industrial demand taking root in the north. The capacity mix is shifting, with new nuclear, significant battery storage, and a growing intermittent renewable fleet changing the shape of supply. The market itself has been redesigned, and for the first time, new capital is being deployed at scale with meaningful exposure to market price signals, something Ontario has not seen before. The LT2 energy results fit squarely within that transition: intermittent renewables are providing low-cost energy to the extent the system can integrate them, with solar taking a larger role than this province has historically seen.
Perhaps the most underappreciated signal in the results is who won. Approximately 50% of the solar capacity awarded went to developers with little or no operating presence in the Ontario market today. The traditional IPPs and large generators participated across the board but many were not awarded contracts. Lower development barriers, a more flexible contract structure, and falling equipment costs opened the door to a broader set of participants, and they walked through it. That is a structural shift in who builds Ontario’s energy infrastructure, and it is likely to persist.