BC Hydro’s Power Procurements (2024 and 2025 BC Calls for Power)
Wind development revived after over 15 years on hold
September 9, 2026
In early August, BC Hydro filed the 2025 Call for Power's Electricity Purchase Agreements (EPAs) with the BC Utilities Commission for acceptance, providing more detail behind the results announced in May. The 2025 RFP followed a similar RFP in 2024; together they were the province's first competitive power calls in over fifteen years. The two rounds awarded EPAs to fourteen projects in total, with 2.8 GW of installed capacity and 8.3 TWh of annual energy, all on 30-year contracts: 1.6 GW across ten projects in the 2024 call, and 1.2 GW across just four in the 2025 call.
The 2024 and 2025 procurements are the start of BC's next build cycle, driven by federal and provincial ambitions to substantially grow electricity production and use it to unlock growth across key industries, notably LNG and mining in BC's case. This note walks through what developers, investors and large loads need to watch as that momentum builds, and what inferences can be drawn from the recent results. Key takeaways include:
- Future procurement depends on industrial load growth in the North: that growth, in turn, depends on the scale and success of the North Coast Transmission Line (NCTL) and the initial LNG projects to justify it. Northern industrial growth could add as much as 35 TWh of new demand, enough to support regular procurements through the next decade.
- Awarded projects likely absorbed remaining available transmission capacity:connecting more will increasingly require new grid investment, especially in the most economic regions.
- Wind development in the most economic regions is expected to hit familiar constraints: 82% of awarded energy was contracted with projects in the Peace region of Northeast BC and the South Interior near Kamloops, creating an opportunity for wind development in diverse regions and potentially solar.
Foundation Economics has supported clients with bid strategy, competitive analysis, and pricing support across Canadian power procurements, including in British Columbia. This note draws on our market knowledge and publicly available results to offer a perspective on what these results reveal and where BC's power market goes from here.
Results at a Glance
The chart below summarizes the 2024 and 2025 RFPs. BC Hydro contracted 4.8 TWh/yr in 2024, above that round's 3.0 TWh/yr target, and 3.5 TWh/yr in 2025, short of a 5.0 TWh/yr target. Purchasing below its 2025 target may reflect some price sensitivity from BC Hydro, choosing not to purchase additional energy above a certain price. The weighted average bid price of awarded projects rose ~10%, from $86/MWh in 2024 to $95/MWh in 2025. The 2025 RFP was more oversubscribed, with 2.6x offered to contracted energy against a ratio of 1.6x in 2024, and the lifted 200 MW cap let average award size nearly double, to 290 MW.
Eleven of the fourteen winning projects (82% of awarded volume) are in two regions, the South Interior and the Peace. In the North Coast Region, 2.6 TWh was offered in 2025 but none cleared. Solar drew four proposals in 2024 and one in 2025, winning just once, in 2024.
BC's last competitive procurement was in 2008, just before North America's wind boom. Installed wind capacity is only 750 MW today, 4% of capacity. These two RFPs add 2,800 MW, lifting that to ~16%, just over Ontario but still below more saturated markets like Alberta, at ~24%.
Northern BC Industrial Development Drives the Build Cycle
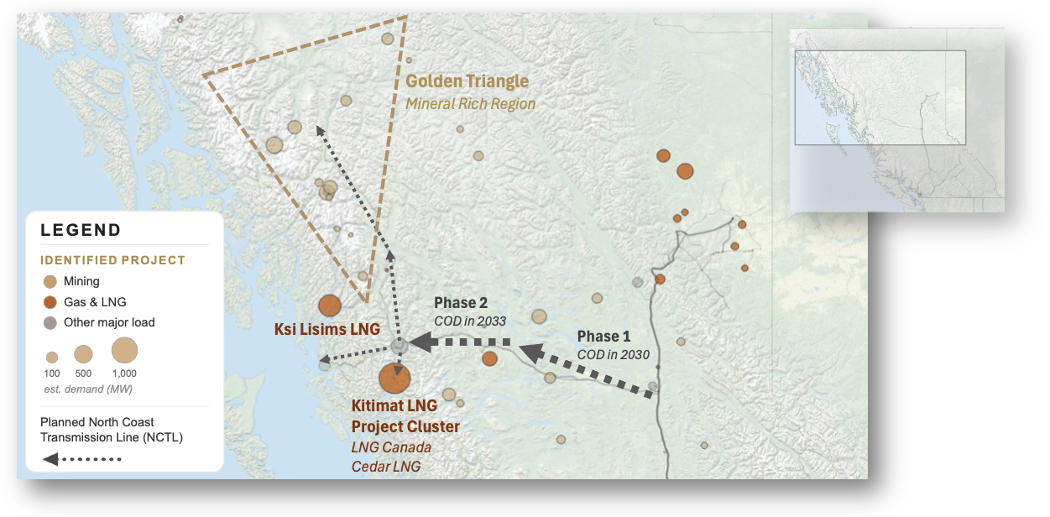
Potential for New Industrial Load in Northern British Columbia
Estimated power demand by identified project
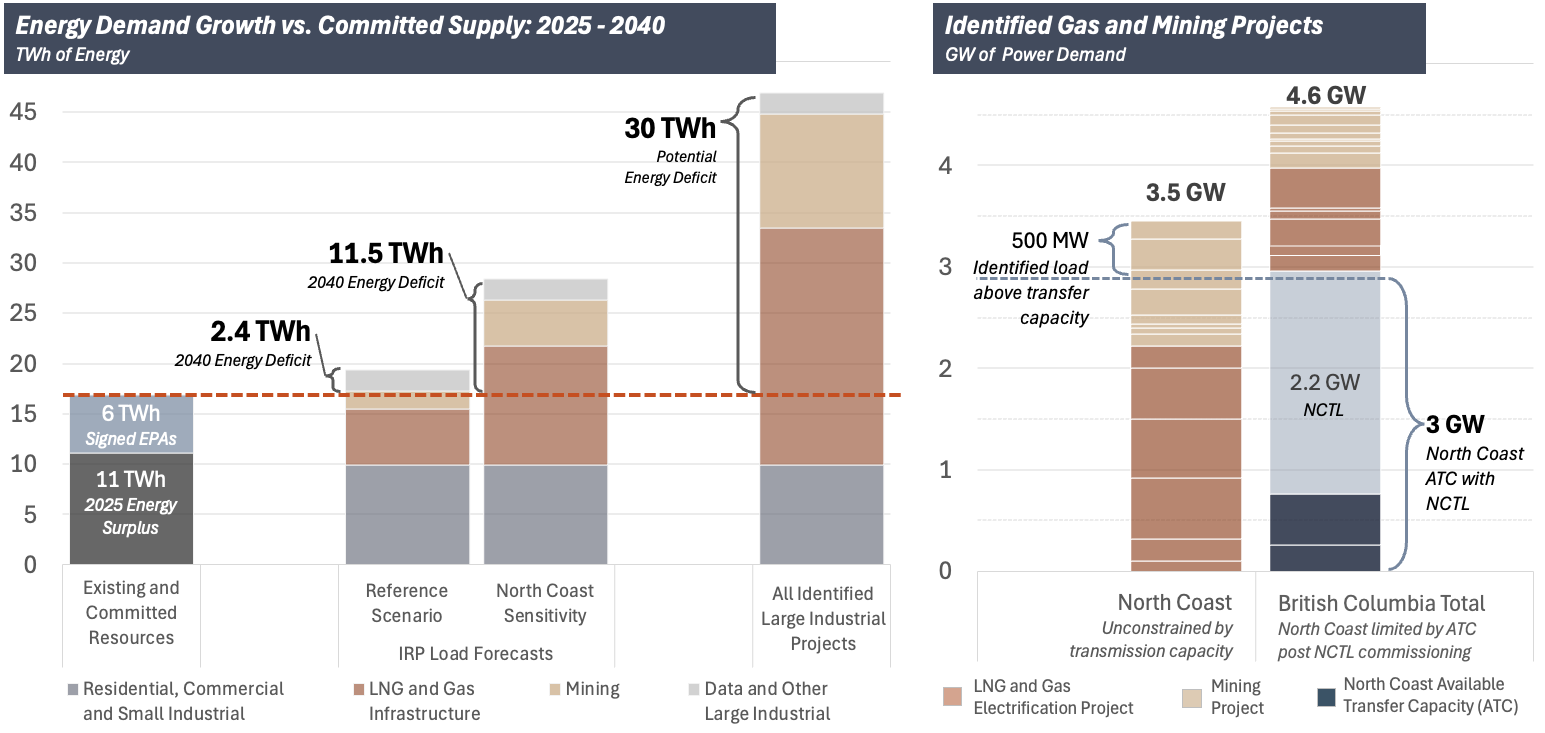
Future procurements will depend on load from large industrial projects in the North, notably LNG export, gas infrastructure electrification, and new mining projects. Without this industrial load growth, BC Hydro will remain in surplus throughout the 2030s, ending the decade at 5 TWh/yr. 1 2025 BC Hydro IRP Reference Load Scenario with mining and oil and gas load growth removed and 2025 EPA volumes added to supply. Note that this assumes BC Hydro's conservative 30% attrition rate, so the true surplus is likely higher. 2 BC Hydro's 30% attrition assumption reflects the 2008 RFP, when 3 of 6 awarded wind projects failed to secure financing and never delivered.
BC Hydro's Reference Scenario, published in its 2025 IRP, includes 7.4 TWh of load growth from northern mining, LNG, and gas-infrastructure electrification, implying only a 2.4 TWh deficit by 2040; however, none of this load growth depends on the North Coast Transmission Line, which the scenario excludes. Meeting it would require only a small procurement, under 900 MW of wind by 2040.
Identified mining and gas projects show the full scale of the region's load growth potential. Foundation Economics has identified 40 projects with an estimated 35 TWh of demand, 3 Total demand in the North Coast limited to 3 GW by current transfer capacity, PGTC upgrades, and NCTL transfer capacity. ~4.7x the Reference Scenario's 7.4 TWh, and ~2x BC Hydro’s North Coast Sensitivity Scenario. This includes gas-infrastructure electrification projects in the Peace region, four LNG projects on the North Coast, and eight critical-minerals mines in the Golden Triangle. At 3.5 TWh per procurement, the size of the 2025 round, BC Hydro would need roughly one call a year through 2035 to serve it all. Not all will proceed, but the identified pipeline is deep enough to sustain repeated procurement well into the 2030s.
The following catalysts, expected over the coming years, will signal the need for further procurements:
- FID of the North Coast Transmission Line: Unlocking this load growth depends on the NCTL, adding 2.2 GW of transfer capacity. Canada and BC have committed $3.9 billion, with the remainder financed through standard BC Hydro rate recovery. Early construction began in September following funding by the Canada Infrastructure Bank. If the schedule holds, both phases COD by 2033. However, BC Hydro has not yet made a final investment decision.
- North Coast LNG Buildout: Only 215 MW of LNG load (that for Cedar LNG) is currently FID-ed. That demand alone is insufficient to trigger another procurement. Additional LNG demand is needed to justify the next call, notably Ksi Lisims (603 MW, already electric by design) and LNG Canada Phase 2 (585 MW, technology undecided but likely sizable). BC Hydro is likely waiting on FID from enough LNG projects to justify the NCTL.
- NCTL Phase 3 and the Golden Triangle: Phase 3 of the NCTL has no firm timelines. However, if the initial phases of the NCTL are built to serve LNG, expansion for mining would likely be economic. Golden Triangle mining could add roughly another 1 GW of demand, about 7.5 TWh a year. That would follow FID on the region's mining projects, and could fuel further procurements into the mid-2030s, with project deliveries late in the decade.
The electrification of LNG creates a unique opportunity to justify the NCTL, backed by a handful of large, discrete projects that can serve as anchor tenants. Coordinating a scattered set of smaller mining projects, each carrying its own timeline and financing risk, with the buildout of the NCTL would be near impossible.
Future Need for New Energy Driven by Large Industrial Load in the North
BC Hydro 2025 Integrated Resource Plan (IRP) and Foundation Economics Estimates
Development Clusters and Transmission Constraints
The map below shows every project Foundation has identified from the 2024 and 2025 Calls for Power, 74 projects in total, roughly twice the number known to have submitted bids in the two RFPs. Development clustered into five regions labeled on the map. The map also shows Foundation Economics' estimate of where high-cost reconductoring and transformer upgrades are needed based on publicly available "CEAP" interconnection studies.
Project Development and Reconductoring Needs
Identified projects based on Foundation Economics’ proprietary database
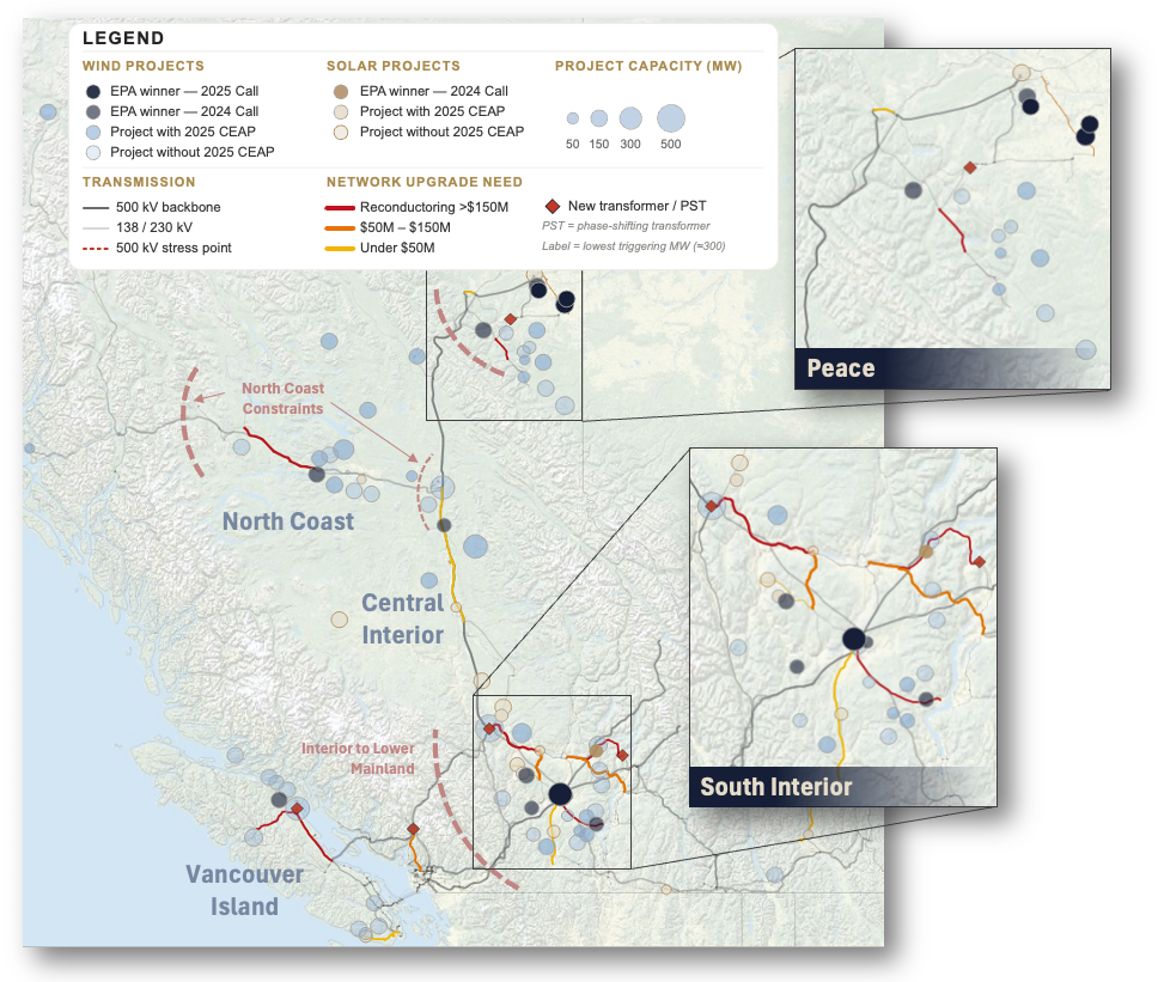
- Projects identified from interconnection studies, PRRD process documents, BCER documentation, and company announcements.
- CEAP is BC Hydro's Competitive Electricity Acquisition Process. Every RFP participant must file an interconnection request and complete a feasibility study before it can bid.
- Reconductoring needs are based on Foundation Economics' review of CEAPs and reflect potential future needs if more projects seek connection.
In total, 171 CEAP studies were filed over the two RFPs, with several projects submitting more than one. 40 of these studies found a thermal overload risk requiring reconductoring, while 15 more, across nine projects, triggered a new power transformer at five substations, adding hundreds of millions each. Together, these findings show where the grid is constrained and the largest investments are needed to connect further projects.
Several clusters of identified projects would require transmission upgrades to connect. Two stand out because they sit in the regions with the most economical projects. In the western Peace, 10 identified projects depend on a single line. In the South Interior, nine sit along two lines that need upgrading. CEAP studies explicitly exclude impacts to the 500 kV bulk transmission system, but limits exist there too and can be inferred from other BC Hydro documents. The map also highlights these stress points; the most notable are getting power into the Lower Mainland, out of the Peace, and to the North Coast.
The chart below shows Foundation Economics' estimate of the cost of interconnection tied to each participating project in the 2024 and 2025 bids. Which CEAPs tie to which projects, and which were used in a bid, are not publicly known; the estimate draws on publicly available CEAP studies. Projects are not responsible for the cost of interconnection, so their bids do not include it; however, BC Hydro effectively added the CEAP cost back into project bids when evaluating them.
Estimated CEAP Costs for Participating Projects: $MM
CEAP to project and CEAP to bid links are Foundation Economics estimates from public data
The chart shows several clear step ups in costs: taps often under $15mm, direct substation connections $20mm to $40mm, and new substations $75mm to $105mm. Once reconductoring is added, costs rise sharply, with many estimates well above $150mm, though few of those projects bid.
Two things show the last two calls may have already used up the grid's spare capacity, and the next call will require real grid investment. Average cost across every CEAP filed (including non-bidders and multiple studies per project) rose from $67 million in 2024 to $165 million in 2025. Separately, Remedial Action Scheme (RAS) requirements, automatic, uncompensated curtailment during a grid event, roughly doubled between calls, to 62 of 92 studies in 2025, evidence that more projects are being managed through curtailment rather than a grid that can simply absorb them.
The project-specific CEAP process has a structural flaw for efficiency across the overall grid. Each study prices a full upgrade against a single project, so where projects share a corridor, the same work gets priced repeatedly. BC Hydro would get a more economic result, and unlock regions like the Peace, by pricing shared upgrades once and splitting the cost among the projects that use them, instead of assigning it in full to whichever project studies first.
BC is not the first jurisdiction to face this challenge. Other North American grid operators have moved toward cluster studies that share upgrade costs across projects; MISO, SPP and AESO are just some examples. But cluster studies add time, and a single project withdrawing from the cohort creates confusion for the study process. Other ISOs have led with infrastructure development specifically to unlock targeted regions, building ahead of demand instead of studying it as it arrives. Texas built CREZ, a $7 billion corridor to support wind projects when it first faced this problem nearly 20 years ago in 2008. PJM's proactive build cut its Cycle 2 upgrade costs by $8.7 billion between phases. This sidesteps the coordination problem, but requires that the utility pick the region ahead of procurements.
Regional Project Economics and Growing Opposition
Wind Project Economics by Region
Foundation Estimates for Select Identified Projects
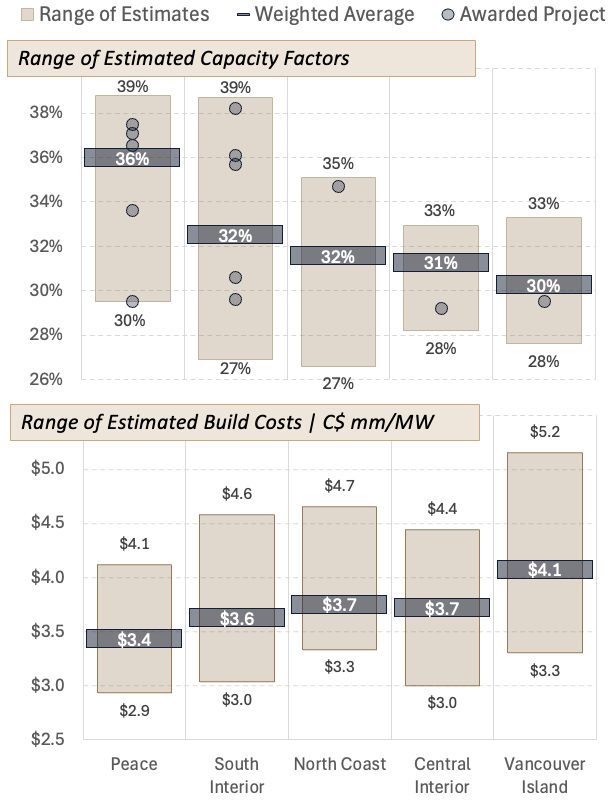
The chart to the right shows Foundation Economics' range of capacity factor and build cost estimates for identified projects across BC's major regions. These estimates are drawn from the firm's proprietary models, built for competitive review. The Peace is clearly the most competitive, with the highest average capacity factor and the lowest build cost in the province. The cost advantage in this region is driven by relatively flat land and easy transport links to the rest of the continent; the Peace is the only region east of the Rocky Mountains. This conclusion is reinforced by the fact that every Peace project that has placed a bid has won.
It is intuitive that the most economic regions would win the most contracts. But like most RFPs, the evaluation formula credits projects in higher-value locations, through avoided Cost of Incremental Firm Transmission (CIFT) and lower transmission losses. Foundation Economics estimates the benefit for a project on Vancouver Island over one in the Peace at roughly $15-$22/MWh, a spread we consider too narrow to make the region competitive on its own. Vancouver Island drew zero bids in 2025. It is worth noting that the CEAPs filed in 2025 were for much larger projects, 500 MW and up, consistent with developers trying to use scale to offset the region's weaker economics. Four of the five CEAPs identified a need for a new power transformer, driving interconnection costs into the hundreds of millions, likely eroding the scale benefit.
Despite the best project economics in the province, most identified Peace projects never bid in 2025. The region is facing growing organized local pushback. Peace River Regional District landowners and officials have opposed the pace of development since mid-2024, citing the lack of environmental assessment, cumulative land-use effects and decommissioning liability. Caribou habitat protection, an issue numerous stakeholders have raised, is increasingly limiting where new Peace wind projects can be sited. Renewable development in BC seems to be following a familiar trend: the region with the best economics hits land-use limitations or community opposition, opening the door for other regions to develop instead.
Future Opportunity for Solar?
Solar has not been meaningfully competitive in BC, which fits widespread expectations. But solar is becoming increasingly competitive in northern jurisdictions, of which Alberta, New York, and Ontario provide recent examples. Ontario's most recent RFP, for instance, awarded 12 of 14 contracts to solar projects. In BC's two RFPs, five solar projects bid, and only one won, in 2024, and that award came only after a wind farm backed out, implying the solar project was the highest-cost bid still standing.
Implied solar capacity factors in BC are comparable to those in Ontario, and therefore resource quality is not the limiting factor. However, a consequence of the province's hydro-dominated capacity mix is that the solar generation profile is less valuable for the BC grid than in other jurisdictions. BC Hydro has reflected that reduced value for solar capacity in its contract design and RFP structure. One of solar's key advantages, especially while its penetration is still modest, is providing energy during the traditional peak time when the marginal cost of generating energy is highest. This advantage does not apply in regions with substantial hydro storage.
Both the contract's time-of-delivery factors and its capacity credit work against the generation profile of solar. Consistent with the large hydro capacity in BC, the contract assigns the lowest value for these parameters during the May-June freshet. However, this snowmelt period coincides with two of the best months for solar generation. As well, solar lacks the seasonal generation profile to earn the capacity credit since this requires delivering continuous energy for 16 hours a day from November through February. By Foundation Economics' estimate, that seasonal effect costs solar a 9% revenue penalty against wind, equating to roughly $9/MWh on a $95 bid. In Ontario, by contrast, Foundation Economics estimates solar had a revenue advantage of roughly 10-12% compared to wind.
However, solar has development and siting advantages over wind that grow more valuable as wind penetration increases: a shorter development timeline and fewer siting constraints. Solar resource is also often more consistent across a wider area, a significant advantage in regions where local opposition has built up against a strong wind resource. That siting flexibility, combined with solar's lower need for scale, lets it tap less congested points on the grid. Should panel costs stay low, there may be an opportunity for select solar projects in BC to be competitive.